Monday, January 31, 2011

Demantra 7.3.1 released

Few key features which 7.3.1 has to offer are:
  • Support for Service Parts Forecasting: Seeded integration now available between Demantra and Service Parts Planning(SPP) module. For customers implementing SPP module this integration can help them use Demantra for developing a more accurate Service(Spare) Parts forecast.
  • Support for Multiple Business Processes: Forecast tree and Causal Factors can now be setup differently for each engine profile, allowing better flexibility around setting up analytical engine for different business processes.
  • Enhanced Proport: Improved Proport process performance by providing additional parameters to control proport run.
  • Worksheet Performance improvement: Additional parameters to create parallel hints for specific worksheets which can help in improving the performance of Demantra worksheets.
  • Support for Rolling Data Profile Groups: Users can now assign rolling data profiles to a group and then can call these groups for execution using workflow. This feature increases flexibility around archiving process within Demantra.
New versions of various Demantra documentation now available in Oracle MySupport @
Oracle Demantra Documentation Library [ID 443969.1]

Wednesday, November 17, 2010

Demantra 7.3: Engine split based on series

Whas is NEW ?:
Demantra 7.3 has come up with quite few features which customers have been wishing to see. One of these is ability to split statistical forecast which generated at aggregated level to split down to lowest level based on user defined/controlled proportions. Prior to 7.3 this split was always based on historical proportions and there was no workaround for it. These historical proportions were calculated based on every product and location combinations historical monthly sales averages using proport procedure. Split by series option allows user to pick a series which dictates weights for dis-aggregation of baseline forecast.

How we USE it?
1. Define a new series with server expression, the server expression gets used in weight calculation.
2. Using Business modeler setup parameter: ENGINE > PROPORT tab > parameter name "ProportionSeries" shall be populated with the internal name of the above series.
3. Select combinations/population to use SPLIT MECHANISM by using series "Engine Proportion Method" in a worksheet. The series has two dropdown values, Matrix Based Proportions which is the default and Series Based Proportions which is the value required for series based split.

Monday, August 9, 2010

Oracle Open World 2010: Sales and Operations Planning for the Food and Beverage Industry

Join us at Oracle Open World 2010 for a session on "Sales and Operations Planning for the Food and Beverage Industry"

http://www.eventreg.com/cc250/sessionDetail.jsp?SID=315911

Friday, June 18, 2010

Oracle E-Business Suite, Virtualization and Cloud Computing

Oracle E-Business Suite, Virtualization and Cloud Computing
New and Valuable Capabilities in this Oracle Release
February 3, 2010,
Volume 144, Issue 1

Oracle E-Business Suite 12.1.1 in a five-part nutshell.

http://blogs.oracle.com/stevenChan/2010/01/ebs_live_migration_ovm.html

In a five-part series on virtualization and cloud topics, Ivo Dujmovic, an architect in Oracle's Applications Technology Integration group, offers a detailed view of the Oracle E-Business Suite 12.1.1 for prospective and current users.


Read the complete article by clicking on this link "Oracle E-Business Suite, Virtualization and Cloud Computing"


Oracle Cloud Computing - Oracle Wiki

Oracle Cloud Computing - Oracle Wiki

Friday, April 16, 2010

Cloud Computing


Definition:
As defined by NIST(national institute of technology) Cloud computing is essentially on demand access to computing resources.

It has essential characterstics of on demand self service, resource pooling, rapid elasticity to scale out and scale in, the ability to meter who is using what and broad network access.

Three service models for cloud computing are:
1. SaaS software as a service, is a prebuilt, vertically integrated application/solution delivered to customer as a service.

2. IaaS infrastructure as a service, is purely providing computing resources, storage and network, as service to the client.

3. PaaS platform as a service. is a flexible combination of above two service models and thus customer can develop and deploy their own application using best of both the worlds.

Deployment models:

1. Public cloud, is shared across multiple customers or tenants and is hosted and managed by a service provider.

2. Private cloud on the other hand is exclusive for an organization and is controlled and governed by that organization.

3. Hybrid cloud is where an organization with a private cloud model uses public clouds for any excess cloud service requirements occassionally. Eg an overflow or for additional workload needs

4. Community cloud is a semi private cloud with access to only a set of defined tenants who share backgrounds or needs

What is driving clouds ?

AGILITY AGILITY AGILITY
The fact that users can provision resources on demand, acquire more resources when needed and release them when done with them, is the key driver for cloud computing.

Any drop off which may occur in the interaction happening between two clouds, might just mean a complete loss of valuable services. It is like two clouds up in the sky and informatiin flashin like lightening going from cloud to cloud and cloud to ground, the possibiltiess of loss of energy is inevitable and that is where the core problem of cloud computing lies.

Amazon web services are already in this niche market. For a public cloud to become a feasible solution for small businesses, the need to ensure the security of transaction and data.

Google OS is another such initiative where we will see a huge participation and usage of cloud computing capabilities.

Wednesday, March 3, 2010

Demantra SIG Webinar: "Infrastructure Rationalization for Demantra Environments"

Demantra SIG group is coming up with their March month webinar, you can join in for learning and understanding Demantra better.
----------------------------------------------------------------------------------------

"Demantra SIG Webinar - 03/10/2010

Please join the Demantra SIG's March Webinar. Arup Chatterjee will be presenting "Infrastructure Rationalization for Demantra Environments"

Space is limited.
Reserve your Webinar seat now at:
https://www2.gotomeeting.com/register/607944203

Title:

Demantra SIG Webinar - 03/10/2010

Date:

Wednesday, March 10, 2010

Time:

8:00 AM - 9:00 AM PST

After registering you will receive a confirmation email containing information about joining the Webinar.

System Requirements
PC-based attendees
Required: Windows® 2000, XP Home, XP Pro, 2003 Server, Vista

Macintosh®-based attendees
Required: Mac OS® X 10.4 (Tiger®) or newer"

---------------------------------------------------------------------------------------

Tuesday, March 2, 2010

Understanding Forecast Bias


What is bias ?
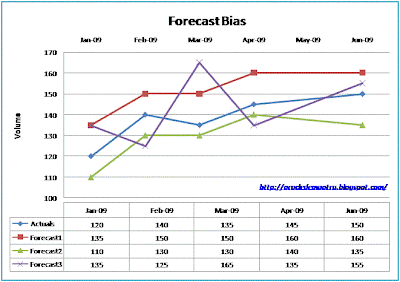
If you observe forecast error going in one direction or other, then you have a forecast which is possibly biased. In the example below try to observe the bias and see if you are able to find the forecast versions with bias.

As you would have pointed out already following is the observation on above example:
  1. Forecast1 has a positive forecast bias
  2. Forecast2 has a negative forecast bias
  3. Forecast3 has mixed bias and the cumulative bias in such case could be insignificant

Decision on whether a forecast is biased or not can be made by reviewing the forecast error as well, study the example below.

Why it exists?
As final forecast is combination of statistical forecast and manual intelligent updates, the bias can slide into Final forecast through any of the mentioned input gateways. While statistical forecast bias are normally specific to items(local bias), bias building up due of manual intervention usually has impact on all the items(global bias).

Manual updates done by forecasters/demand planners at times lead to building of a biased forecast. These updates are driven by various factors like:
- Increasing forecast to match up with volume targets
- Optimistic or pessimistic approach towards forecasting
- Expecting Promotional incremental sales volume
This kind of bias usually has impact on all the items.

Bias found in statistical forecast is most of the times under-forecasting or over-forecasting situation for a specific item-location combination. Few of the cases which lead to such observation can be list as:
- Under-forecasting for complete future horizon due of recent months sales volume showing a down trend.
- A persistent trend in sales volume
Such forecast bias is normally particular to an item or an item-customer combination.

Getting rid of Bias?
Bias shall be removed from forecast as it can assist in improving your forecast accuracy, which eventually reflects across supply chain health. An overall reduction on forecast across all items can take out the global bias(e.g. 15% decrement on forecast numbers all across). For bias which is specific to item, one needs to identify and fix them for every incident by adjusting the forecast.

Perspectives on Managing through Difficult Times